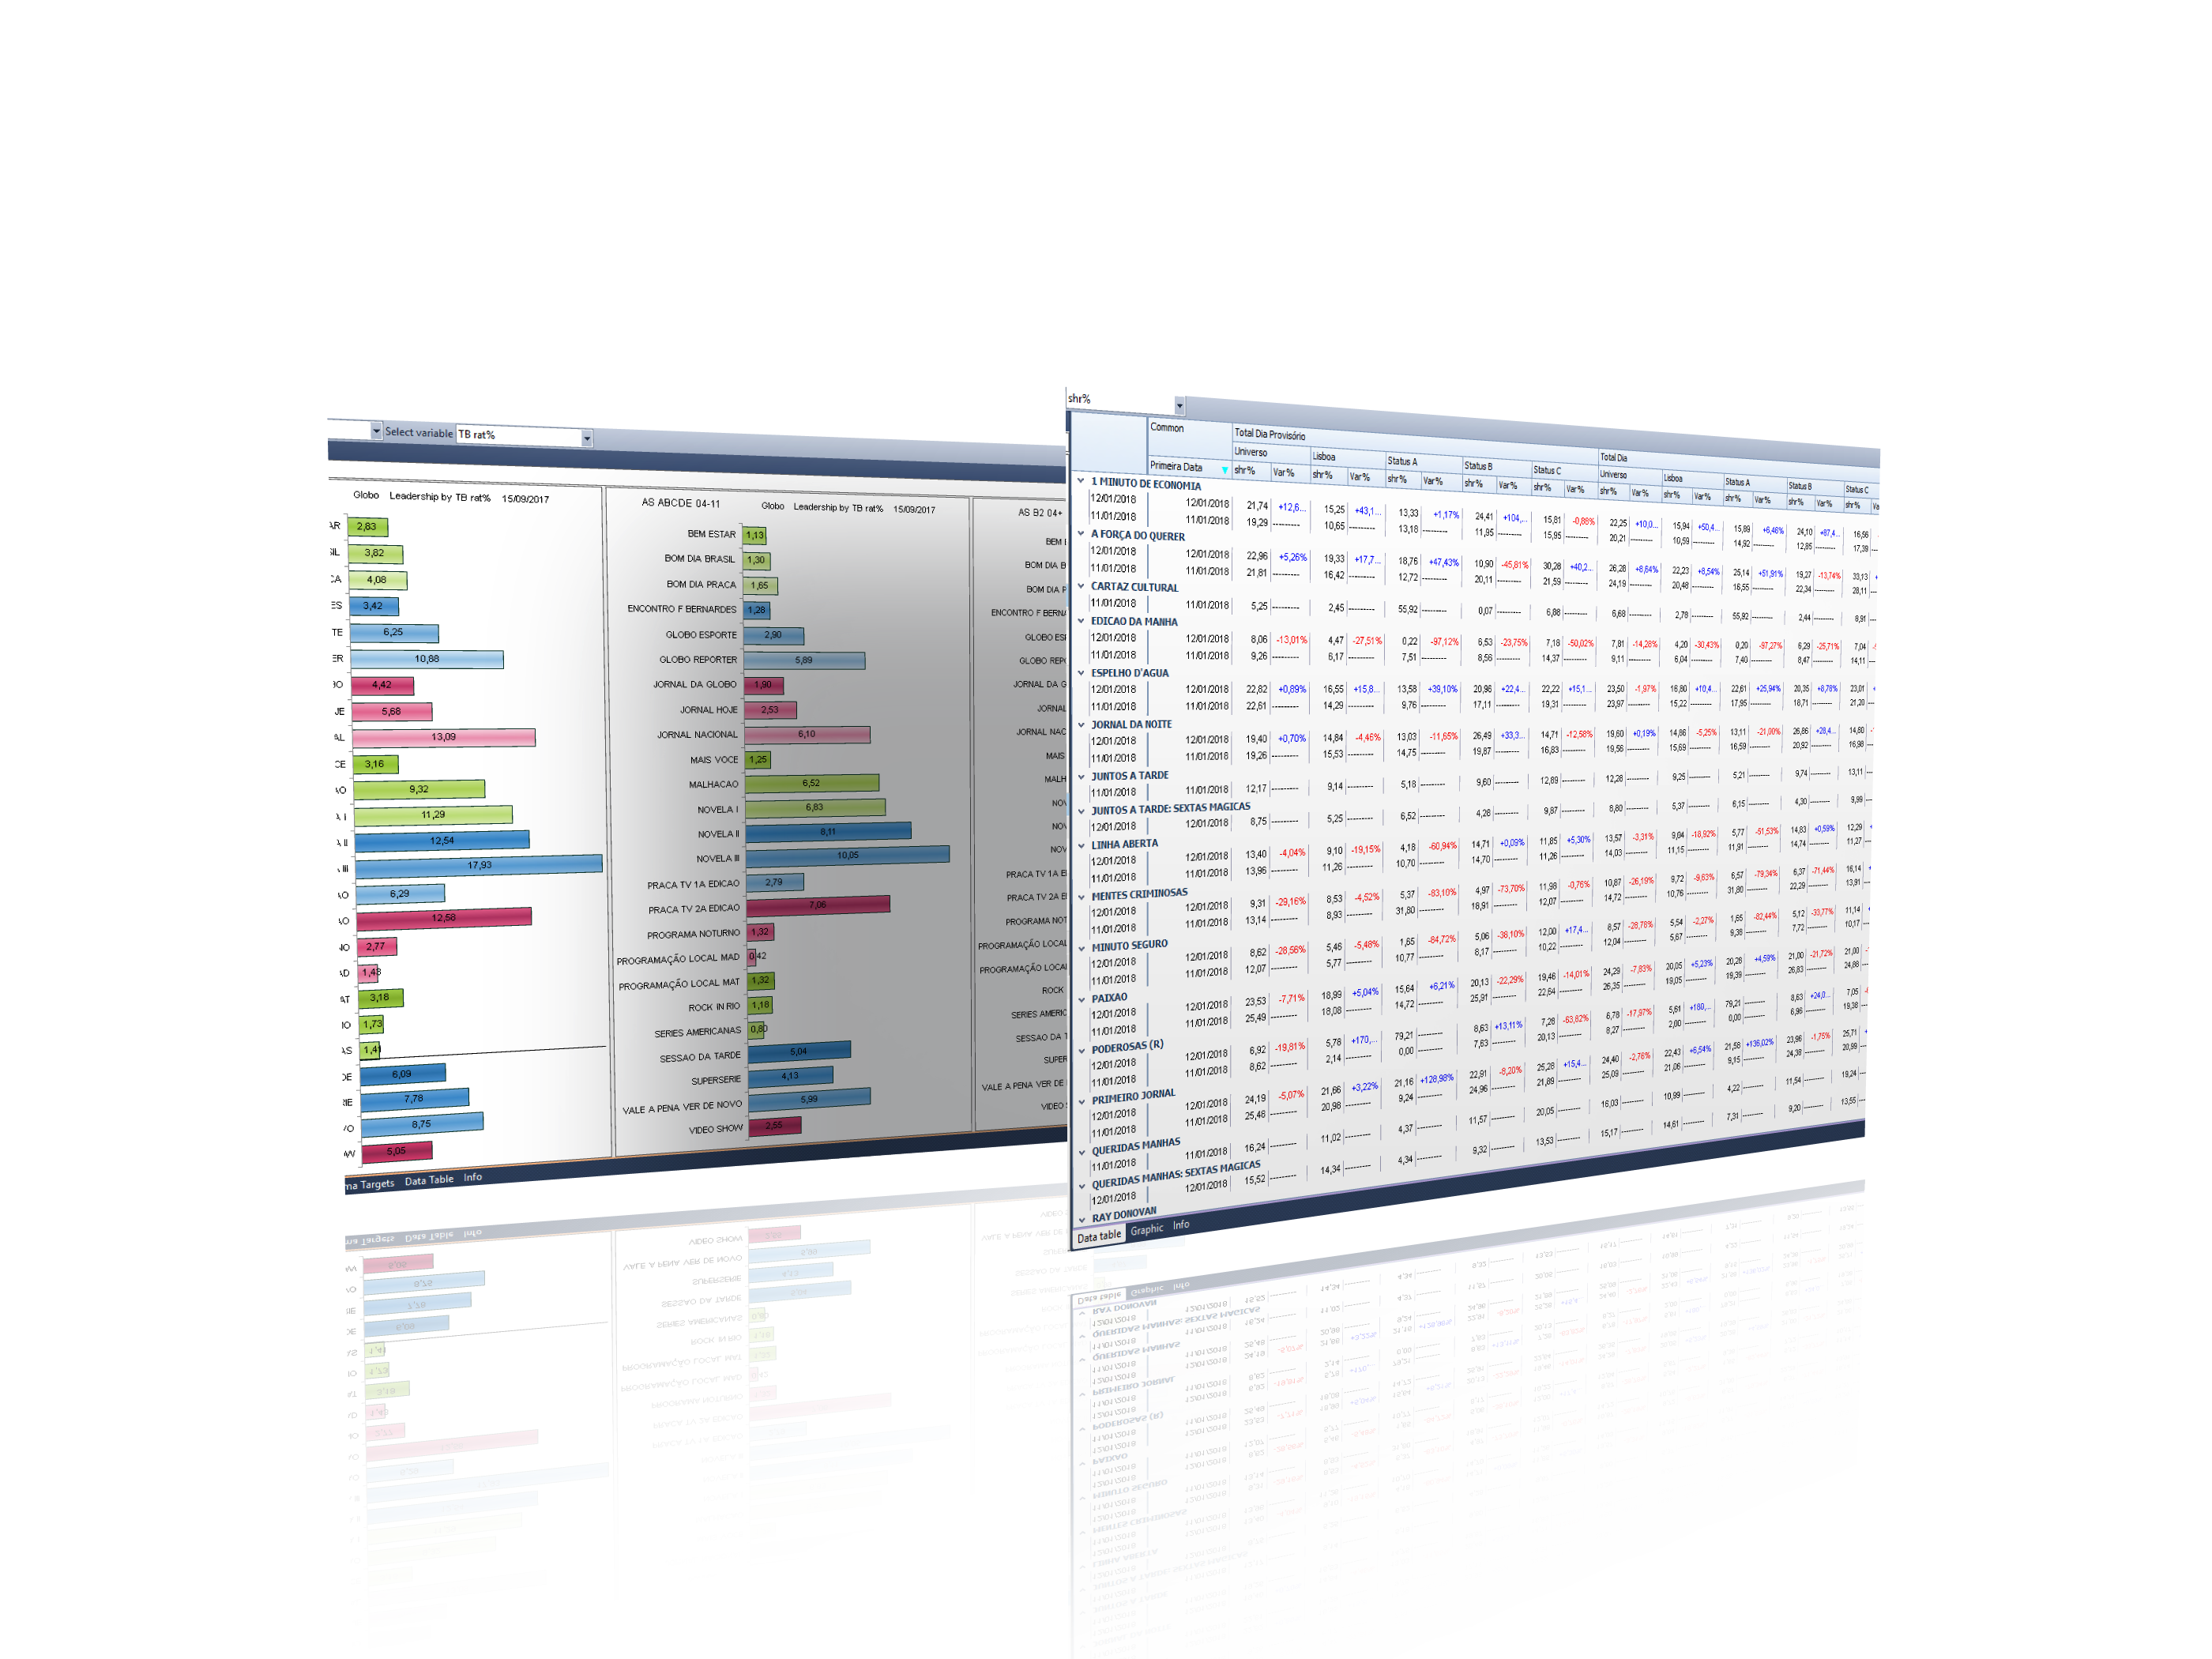
Flexible and Detailed
Research Power
In addition to being able to create your own elements, YUMIANALYTICS has an impressive number of inbuilt variables that allows you to get the inputs that you need. If your data allows so, YUMIANALYTICS can be adapted to include basically anything you ask us. The pool of variables is further enlarged due to the fact that you can create your own variables. This process can also be replicated to create new and extraordinarily accurate targets. If you combine this power with YUMIANALYTICS ‘s flexibility, its potential to create dynamic reports, its ability to reprocess outputs through new angles and its many other features you end up with an impressive research power.

With YUMIANALYTICS, you get the most precise data. The sheer number of angles from which you can analyze is astonishing, which enables YUMIANALYTICS users to be always one step ahead.
Unparalleled
Research Power

Research Features


Channel Lineups
With YUMIANALYTICS it is easy to build Channel Lineups reports. You can also get these modules redesigned specifically for you with custom features.

Use Videos
Complement your reports with videos of the channels and programs that you are studying. YUMIANALYTICS can even stream videos inside dashboards.

Time Band Analysis
Divide the day in custom parts for your reports! Define how you want to set intersection modes, subdivide a custom period into smaller ones and much more.

Grids
Run the classic, yet comprehensive, Grids to get clear views of how, for example, a channel evolved throughout the day.

Multimedia & Multi Database
YUMIANALYTICS is compatible with multiple databases. And yes, you can connect it to different media databases, like Radio or Digital.You can even have DBs from different countries. All in one session!

Individual Analysis
Run AVR and SMH viewer analysis inside YUMIANALYTICS! Simply add the individual variables to your Layout to get individual insights. You can even edit and add new individual variables, like demographics and much more!

Create Dashboards
Create multi-panel dashboards by combining the output of several analyses. The end result can be a beautiful dashboard displaying a variety of useful insights.

Duplication and Exclusivity
YUMIANALYTICS also features modules to run Duplication and Exclusivity reports. Being equipped with the necessary filters, YUMIANALYTICS also allows users to build their own Duplication or Exclusivity reports.

Much More
There is a multitude of different modules inbuilt into YUMIANALYTICS , and you can decide what you want and what you don't need. In addition to this you get modules created just for you or you can even create your own.
Luís Alferes
Client Service
YUMIANALYTICS works brilliantly as a data research software for business in media. Not only does YUMIANALYTICS feature a variety of default modules, we also create custom modules for our users. In my opinion, what makes YUMIANALYTICS even more spectacular is the fact that you can easily tweak any of the modules. This means that you can start with a default change items like the target or the calendar and build a custom module which will be especially adapted to give you an optimum output.

YUMIANALYTICS Challenge 2019
In 2019, Markdata is accepting your challenges. This challenge also applies to Design. So if would like you see features added to your YUMIANALYTICS version, fill in your YUMIANALYTICS Challenge 2019 form and get a free trial.

Contacts
In Markdata, you are our partners and are partners always available to help. Feel free to contact us.
Phone Number
+351 21 317 34 00
markdata@markdata.com
Address
Rua Padre Luis Aparicio, 10 1st floor 1150-248 Lisbon
Follow us on


