Design your Reports

Intelligent Designing

With YUMIANALYTICS you can have Design respond to the displayed data. This means that YUMIANALYTICS is intelligent enough to recognize rules that you might create and to therefore format a cell, column or graph accordingly. This means that if you automatize YUMIANALYTICS ‘s reports the design won’t necessarily be static, it will be dynamic and responsive to the rules that you set. This allows you to create dynamic reports which display in a intuitive way, the best results, the worst results, those which overperformed their past performances or highlight data of a certain target or channel. In addition to this simple rules, you can also create compound rules which allows you to create complex conditions for formatting. This formatting is kept regardless of the data being exported or not.  

YUMIANALYTICS doesn’t just generate data, it generates reports. The ability to create ergonomic and beautifully organized reports is crucial for your information to be received efficiently and YUMIANALYTICS bestows gives you exactly that power. 

Unleash your

Creative mind

Designing Features

Intelligent Design

Our Alert based Intelligent Designing system gives our users the ability to apply Formatting when certain criteria is met. This criteria is freely set by the user.

Sketch it

Don't know how the output will look on a excel spreadsheet? With YUMIANALYTICS's Sketch, you can select how the outputs will be placed, add images, define the page size and much more.
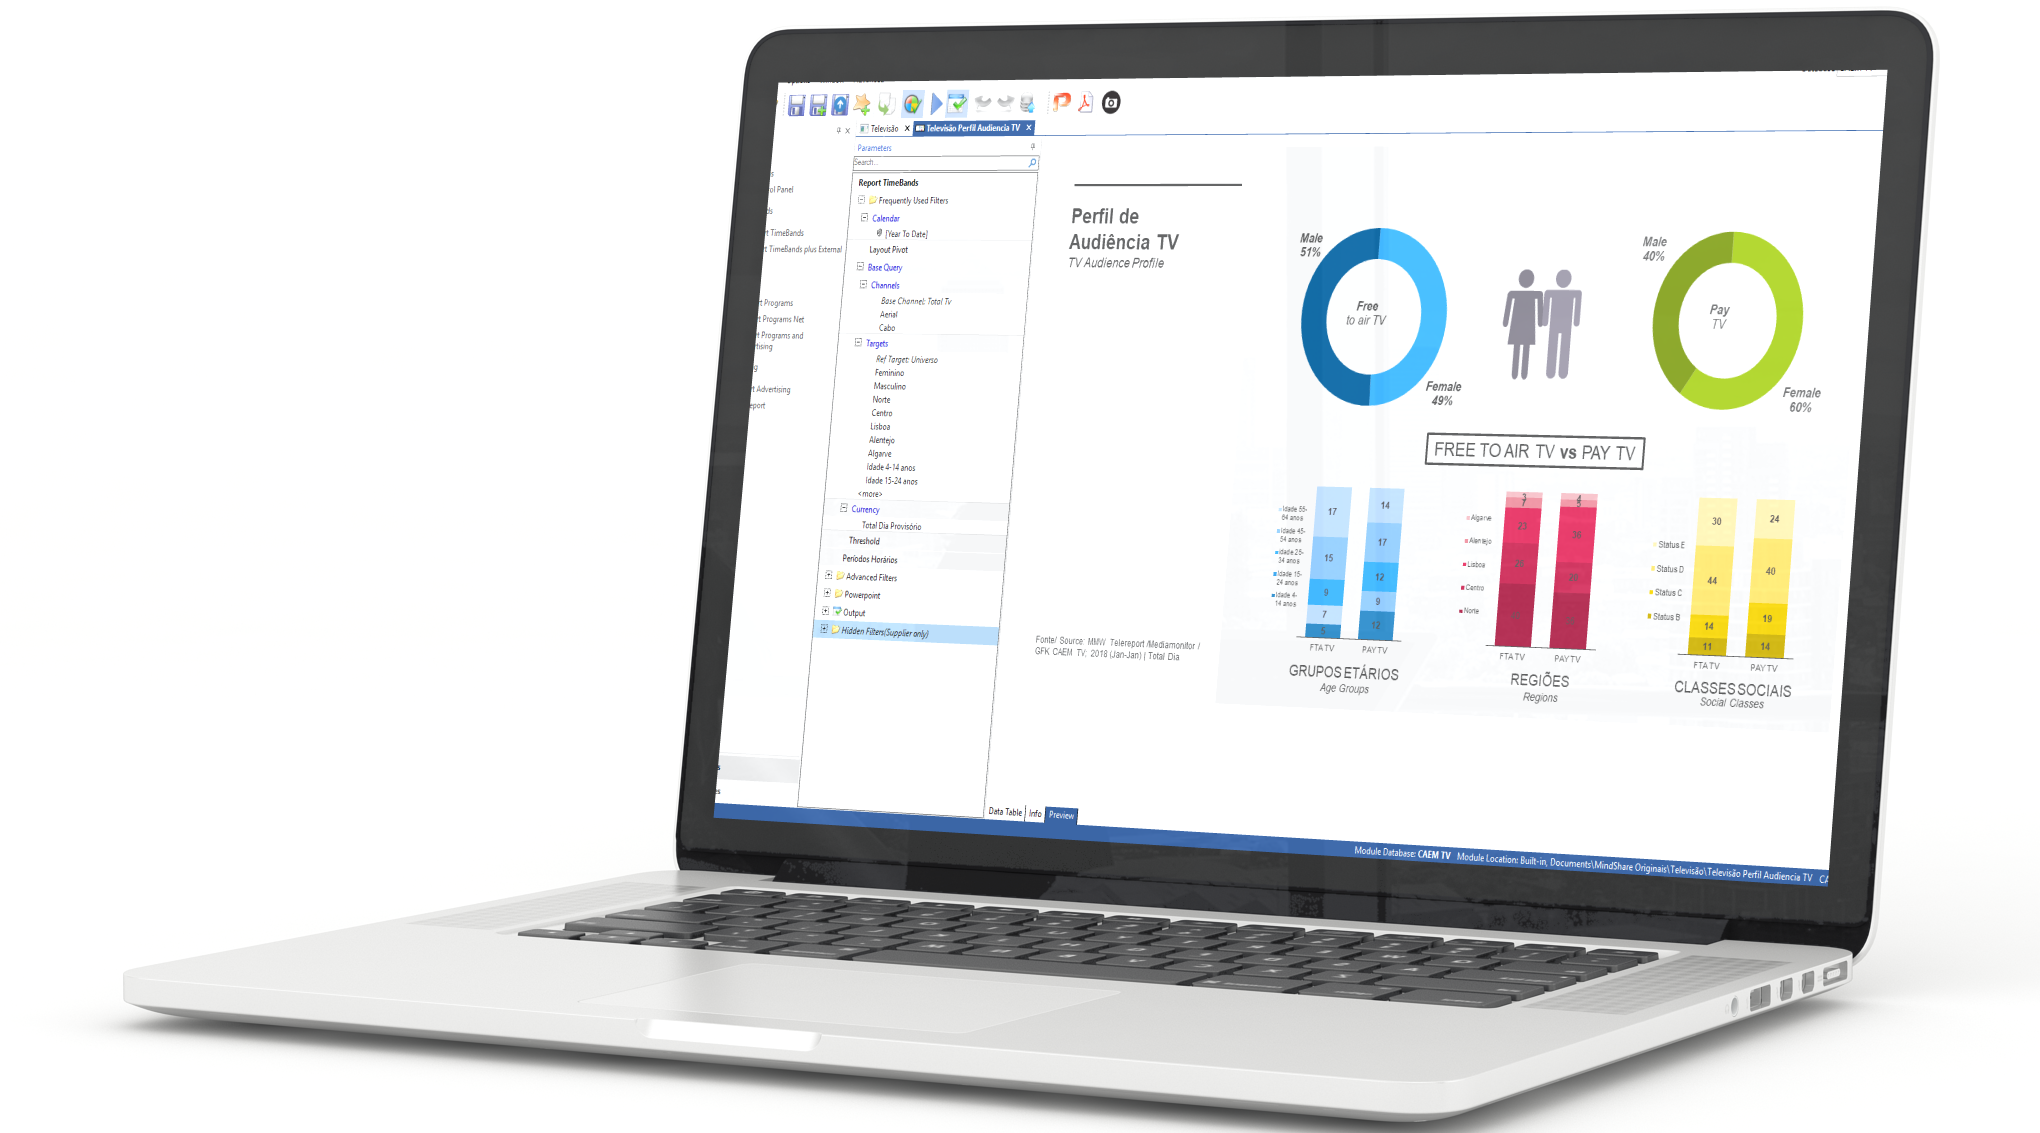
PPT Designing

YUMIANALYTICS's revolutionizing technology allows you to design a PowerPoint template and have your graphs, tables and shapes be fed by YUMIANALYTICS's data, while maintaining its original formatting.

Transformer

The Transformers are a set of tools which gives users the ability to... transform their outputted datatables.

Layout

YUMIANALYTICS's layout options are extremely powerful. With YUMIANALYTICS's layout you can make a wide variety of changes, from simply adding a "Totals" Column to completely changing the way the data is processed.

Graphs

YUMIANALYTICS's Chart Creator tool has a wide variety of options to help our users reach exactly the chart that they were picturing.

Multi-Screen Macros

YUMIANALYTICS has inbuilt drag and drop functions. By using them you can create Macro-Reports displaying the output of several reports.

Add Dynamic Expressions

You can also create drop-down menus inside the app. By doing this you can create extremely dynamic reports that adapt to your needs without requiring you to redefine your Layout.

More

There are many other functions for customizing your reports. You can add background Images, have a chart's colors obey their series's alert color and much more.

Cátia Rosa

Client Service

What I like the most about YUMIANALYTICS is the fact that it is simultaneously so flexible and automatable. Your modules and reports do not need to be bland with YUMIANALYTICS. In spite of having more experience in Design than in any sort of codding, I was able to create reports with the exact Layout and Look that I was going for. You can enrich your information with intelligent alerts, create charts, add color maps, bars representing values and many other features. Another extremely useful feature of YUMIANALYTICS is its power to design and organize how YUMIANALYTICS’s objects will be displayed when exported to Excel, PDF or other formats, with its Sketch feature I can design the exact output that I want to get.

Would you like to add a special feature to your YUMIANALYTICS? Participate in our YUMIANALYTICS Challenge 2019 with your suggestion and win a free trial of YUMIANALYTICS with that new feature!

YUMIANALYTICS Challenge 2019

In 2019, Markdata is accepting your challenges. This challenge also applies to Design. So if would like you see features added to your YUMIANALYTICS version, fill in your YUMIANALYTICS Challenge 2019 form and get a free trial.

astr

Contacts

In Markdata, you are our partners and partners are always available to help. Feel free to contact us.

Phone Number

+351 21 317 34 00

Email

markdata@markdata.com

Address

Rua Padre Luis Aparicio, 10 1st floor 1150-248 Lisbon

Follow us on

This Mobile site is under construction!

Please access the desktop version!